• Home
  • About
  • Clients
  • Contact
Alexis
  • Home
  • About
  • Clients
  • Contact

Charts and graphs

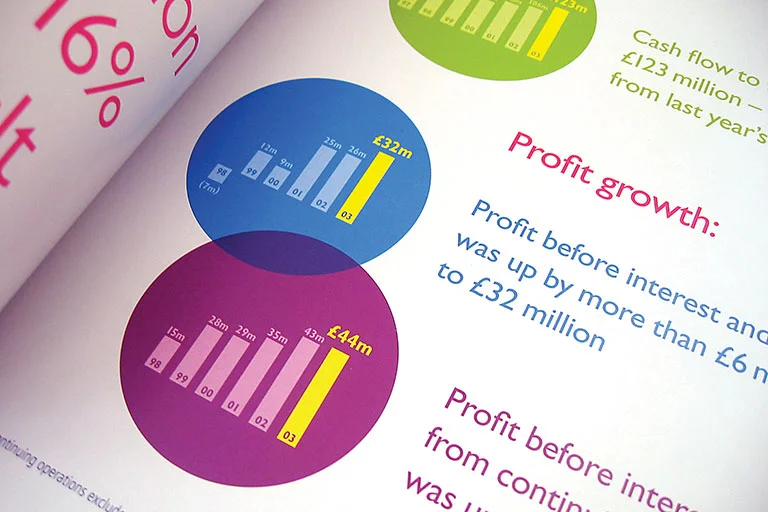
Data is bigger than ever and business is driven by numbers, so we thought we'd put together some of our favourite charts and graphs from a few key projects just to give a flavour of what is possible in representing data and findings to a wider audience.

Related
Infographics | Research & Insight
Channel 4 Sales

BBC Dewey Decimal Classification system (sciences), Alexis Design
Divider 768px.jpg
Channel 4 sales data presentation, Alexis Design
Divider 768px.jpg
BBC Worldwide annual report, Alexis Design
Divider 768px.jpg
Channel 4 public value report design, Single Dramas (large), Alexis Design
Channel 4 public value report design, Single Dramas and Drama Series, Alexis Design
Channel 4 public value report design, Viewer Impact, Alexis Design
Divider 768px.jpg
Digital UK brochure spread, Generational Divide, Alexis Design
Digital UK brochure spread, How is TV Changing, Alexis Design
Deep spacer 768.jpg

© Alexis Design Ltd 2017